Interactive web app visualizing operating system algorithms - page replacement, producer-consumer, and disk scheduling.
I built this during my Operating Systems course at PDEU as my OS lab minor project. Was really excited to take this as an excuse to work with and learn Flask for the first time!
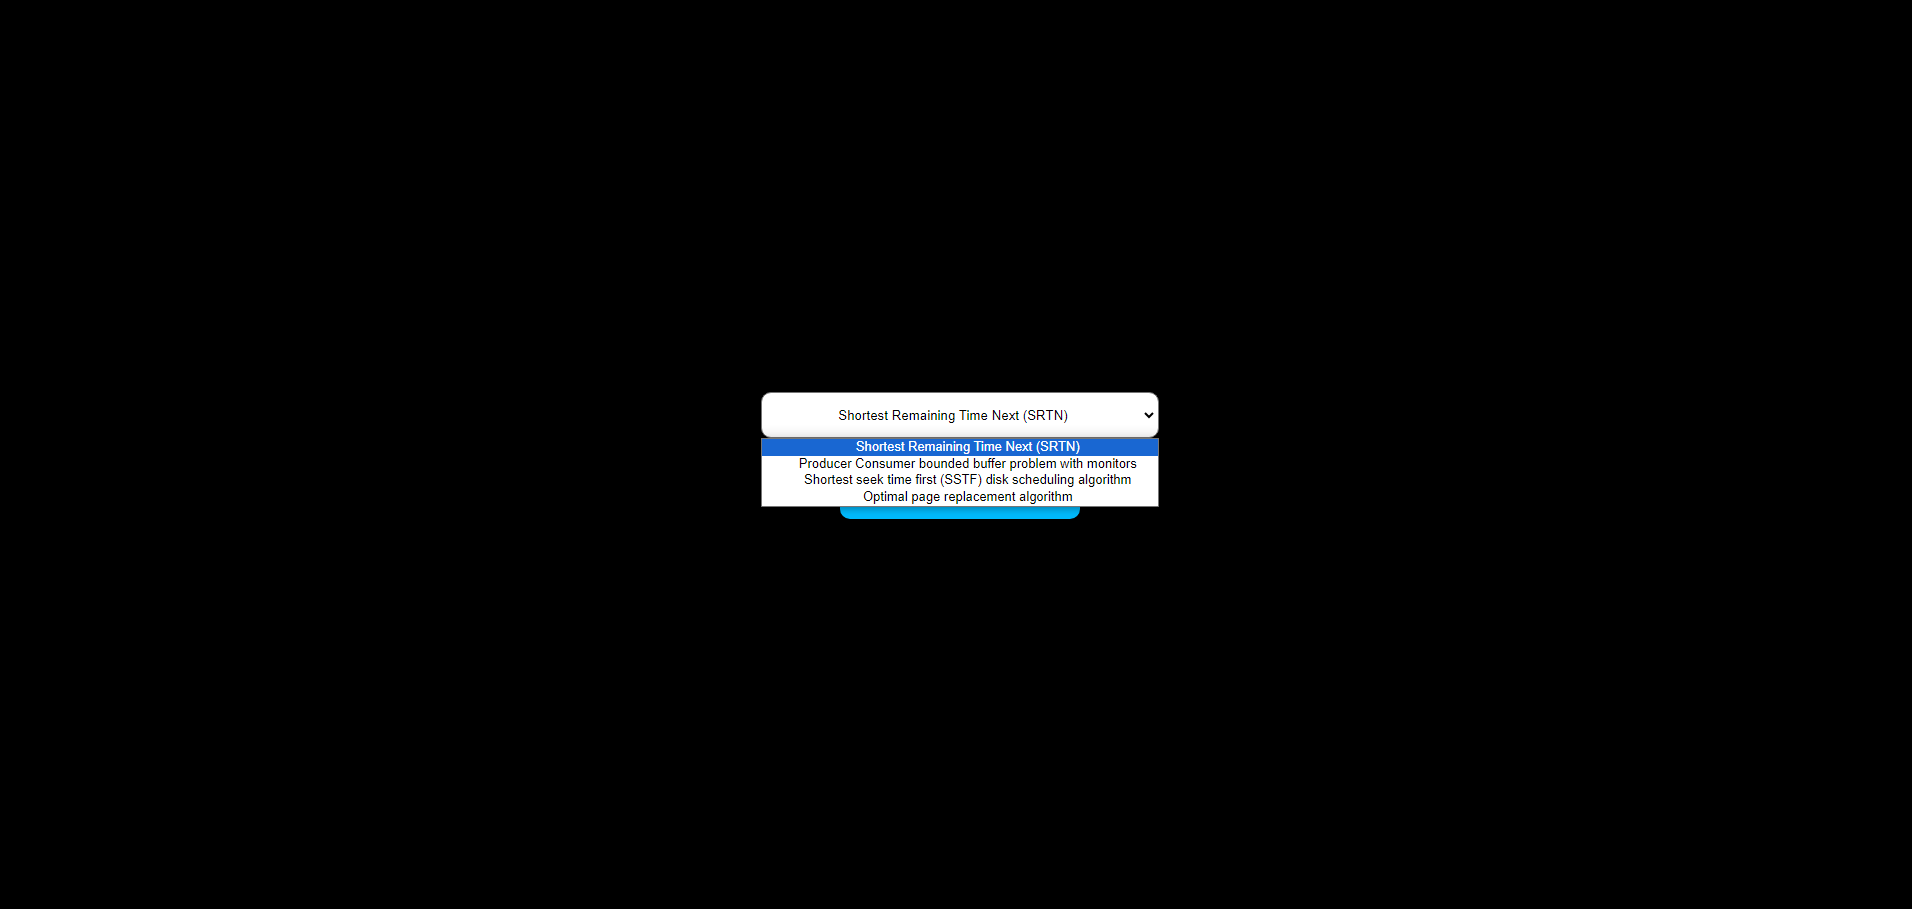
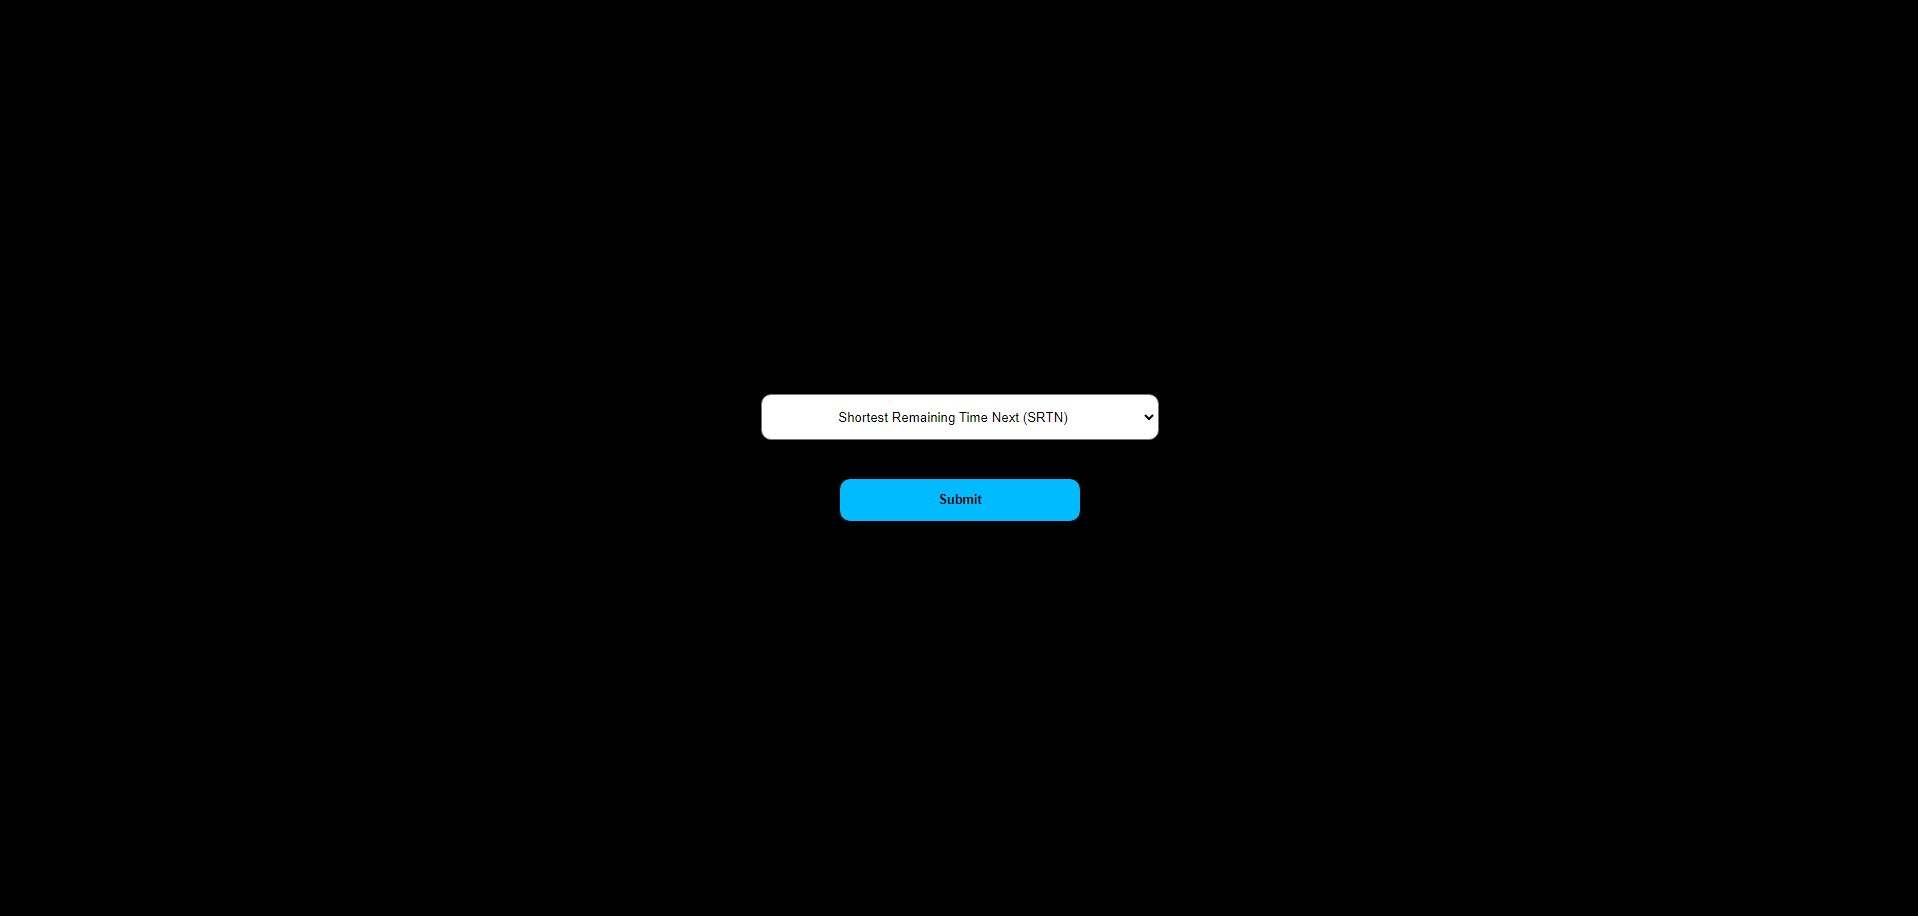
The app brings four foundational algorithms to life: Shortest Remaining Time Next for CPU scheduling, the Producer-Consumer bounded buffer problem with monitors for synchronization, Shortest Seek Time First for disk scheduling, and Optimal Page Replacement for memory management.
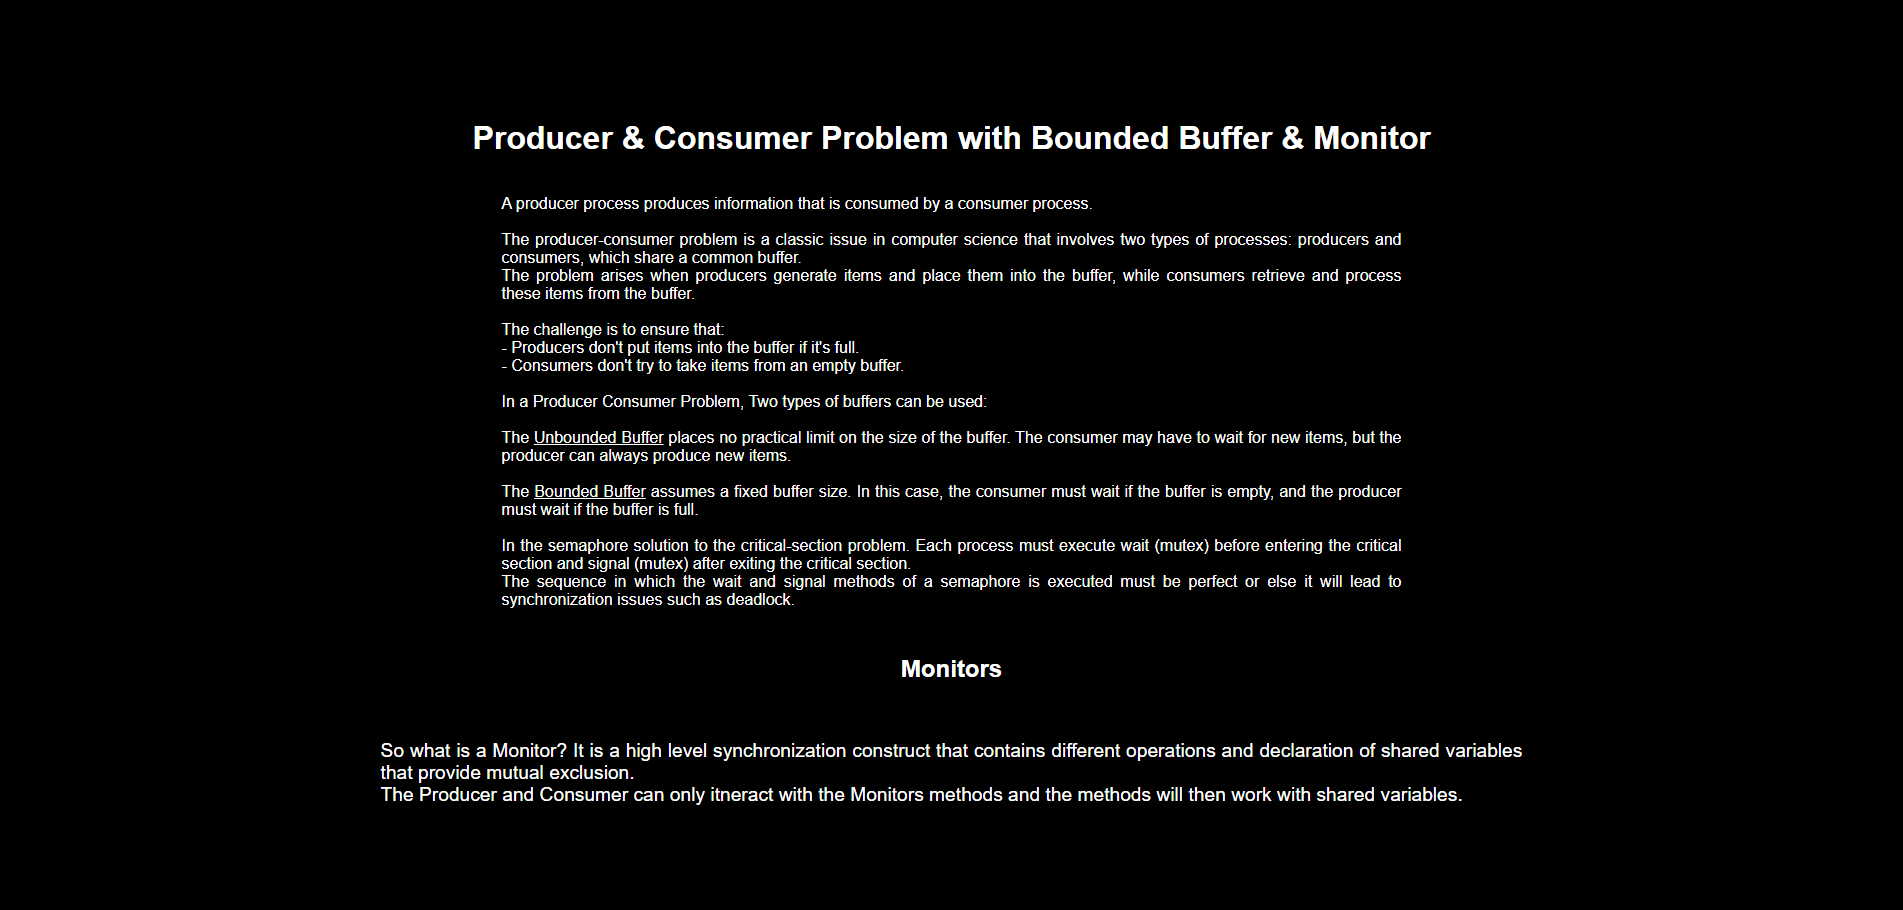
For each algorithm, I built an interactive visualization that lets you supply your own input and step through the execution frame by frame. The SRTN scheduler shows how the CPU preempts running processes whenever a shorter job arrives, making the preemption logic concrete in a way that a static Gantt chart never achieves. The Producer-Consumer simulation shows how buffer states change as producers and consumers operate with monitors enforcing mutual exclusion, making synchronization and race conditions visually obvious.
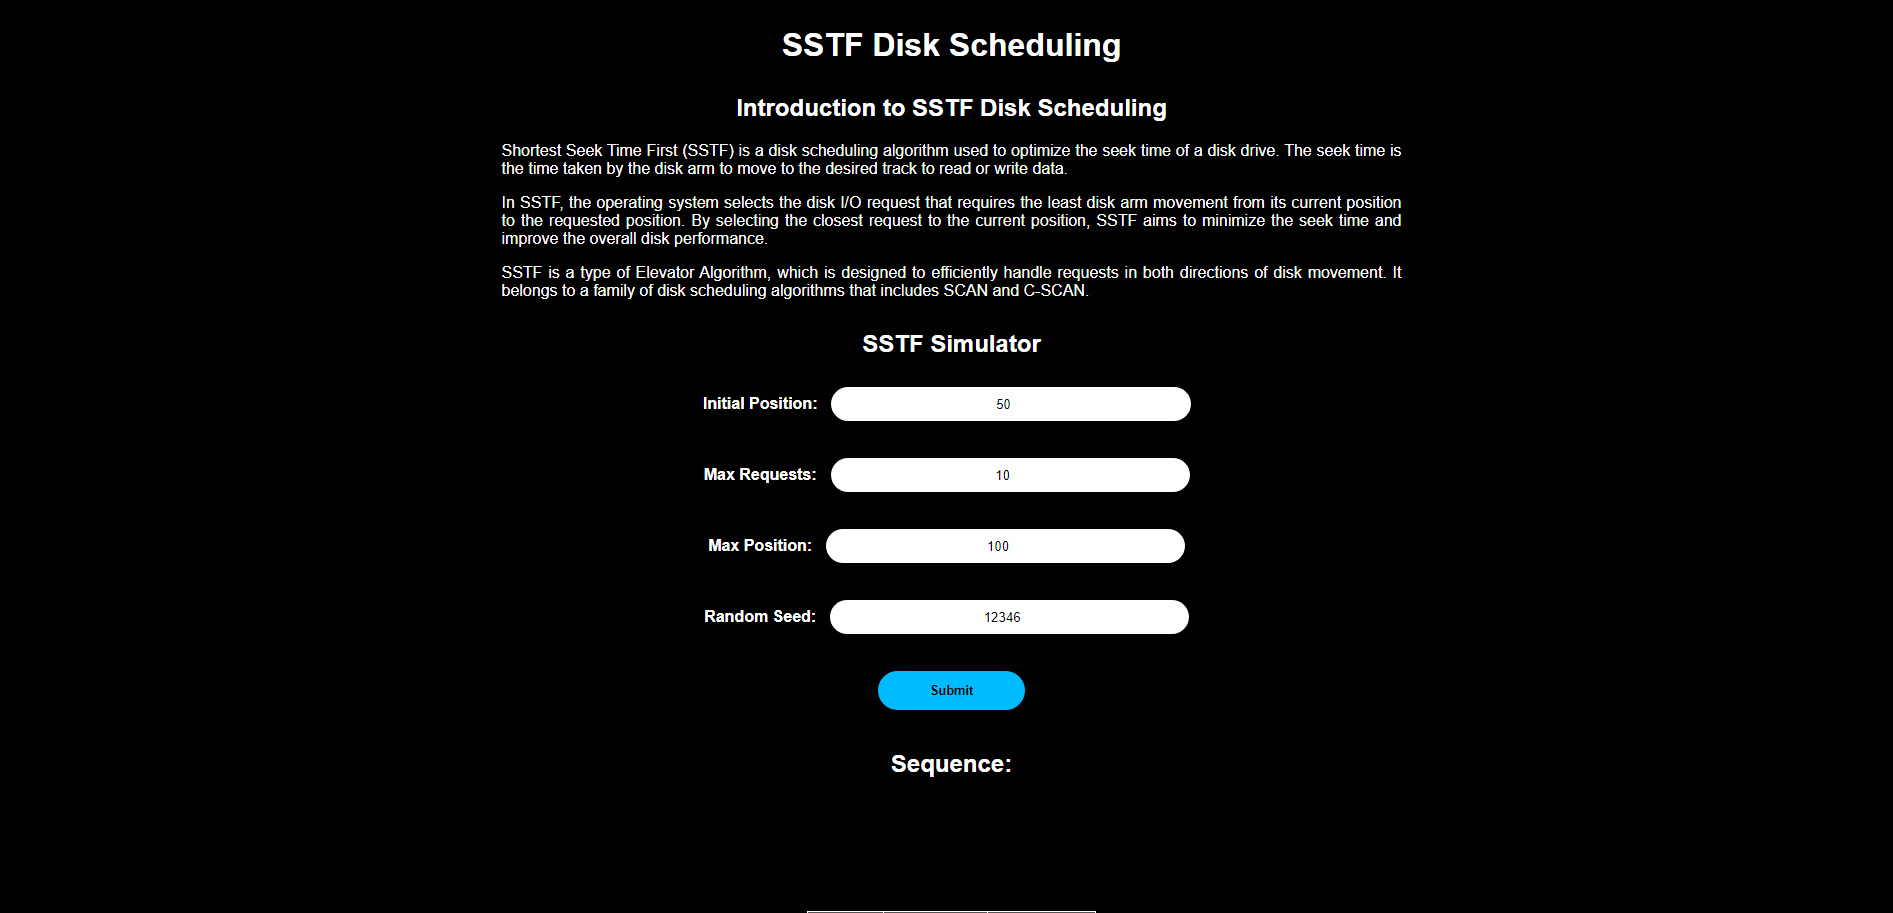
The SSTF disk scheduler lets you watch the disk head move across a track sequence, showing how the algorithm minimizes seek distance by always jumping to the nearest pending request - making the throughput-versus-starvation trade-off intuitive once you can see the head repeatedly skip distant requests. Optimal Page Replacement completes the set, showing exactly which pages get evicted based on future reference prediction.
The backend is a Flask server that handles all the algorithm logic, with the frontend built in plain HTML, CSS, and JavaScript - no framework overhead, just direct DOM manipulation for the step-through animations. It was one of those projects where the constraint of making something genuinely understandable pushed me to think harder about the algorithms themselves than any exam ever did.